A simple and visual application that makes PDRI engaging for all project stakeholders

Carve is a cloud-based application designed to help organizations gain comprehensive insight into their Front End Planning process using data captured during PDRI assessments.

When PDRI assessment data is consolidated into a central repository like Carve, key performance indicators are available in real time through pre-built analytics for PDRI designed to deliver clear visibility into performance from the portfolio level all the way down to individual element scores. With this data, project leaders can easily identify trends and opportunities for process improvement.

If you already have a Carve account, click here to log in.

Carve for PDRI addresses project readiness needs for…

Project Stakeholders

Maximizing PDRI’s value to all project stakeholders.

Portfolio & Program Managers

Supporting risk management by stage gate in front end planning.

Continuous Improvement

Leveraging applied analytics to identify areas for performance improvement.

Carve for Project Stakeholders

One of the main challenges with PDRI is that project team members that attend the half-day readiness review recognize the benefits, but the findings aren’t always accessible or easily understood by other key stakeholders. Carve addresses this gap by sharing results in a simple and visual format.

Project dashboard highlights overall risk

Engage your project stakeholders in a visual manner that easily highlights the risk of each project in front end planning. Carve’s red-yellow-green indicators quickly communicate the risk level of a project at each PDRI stage.

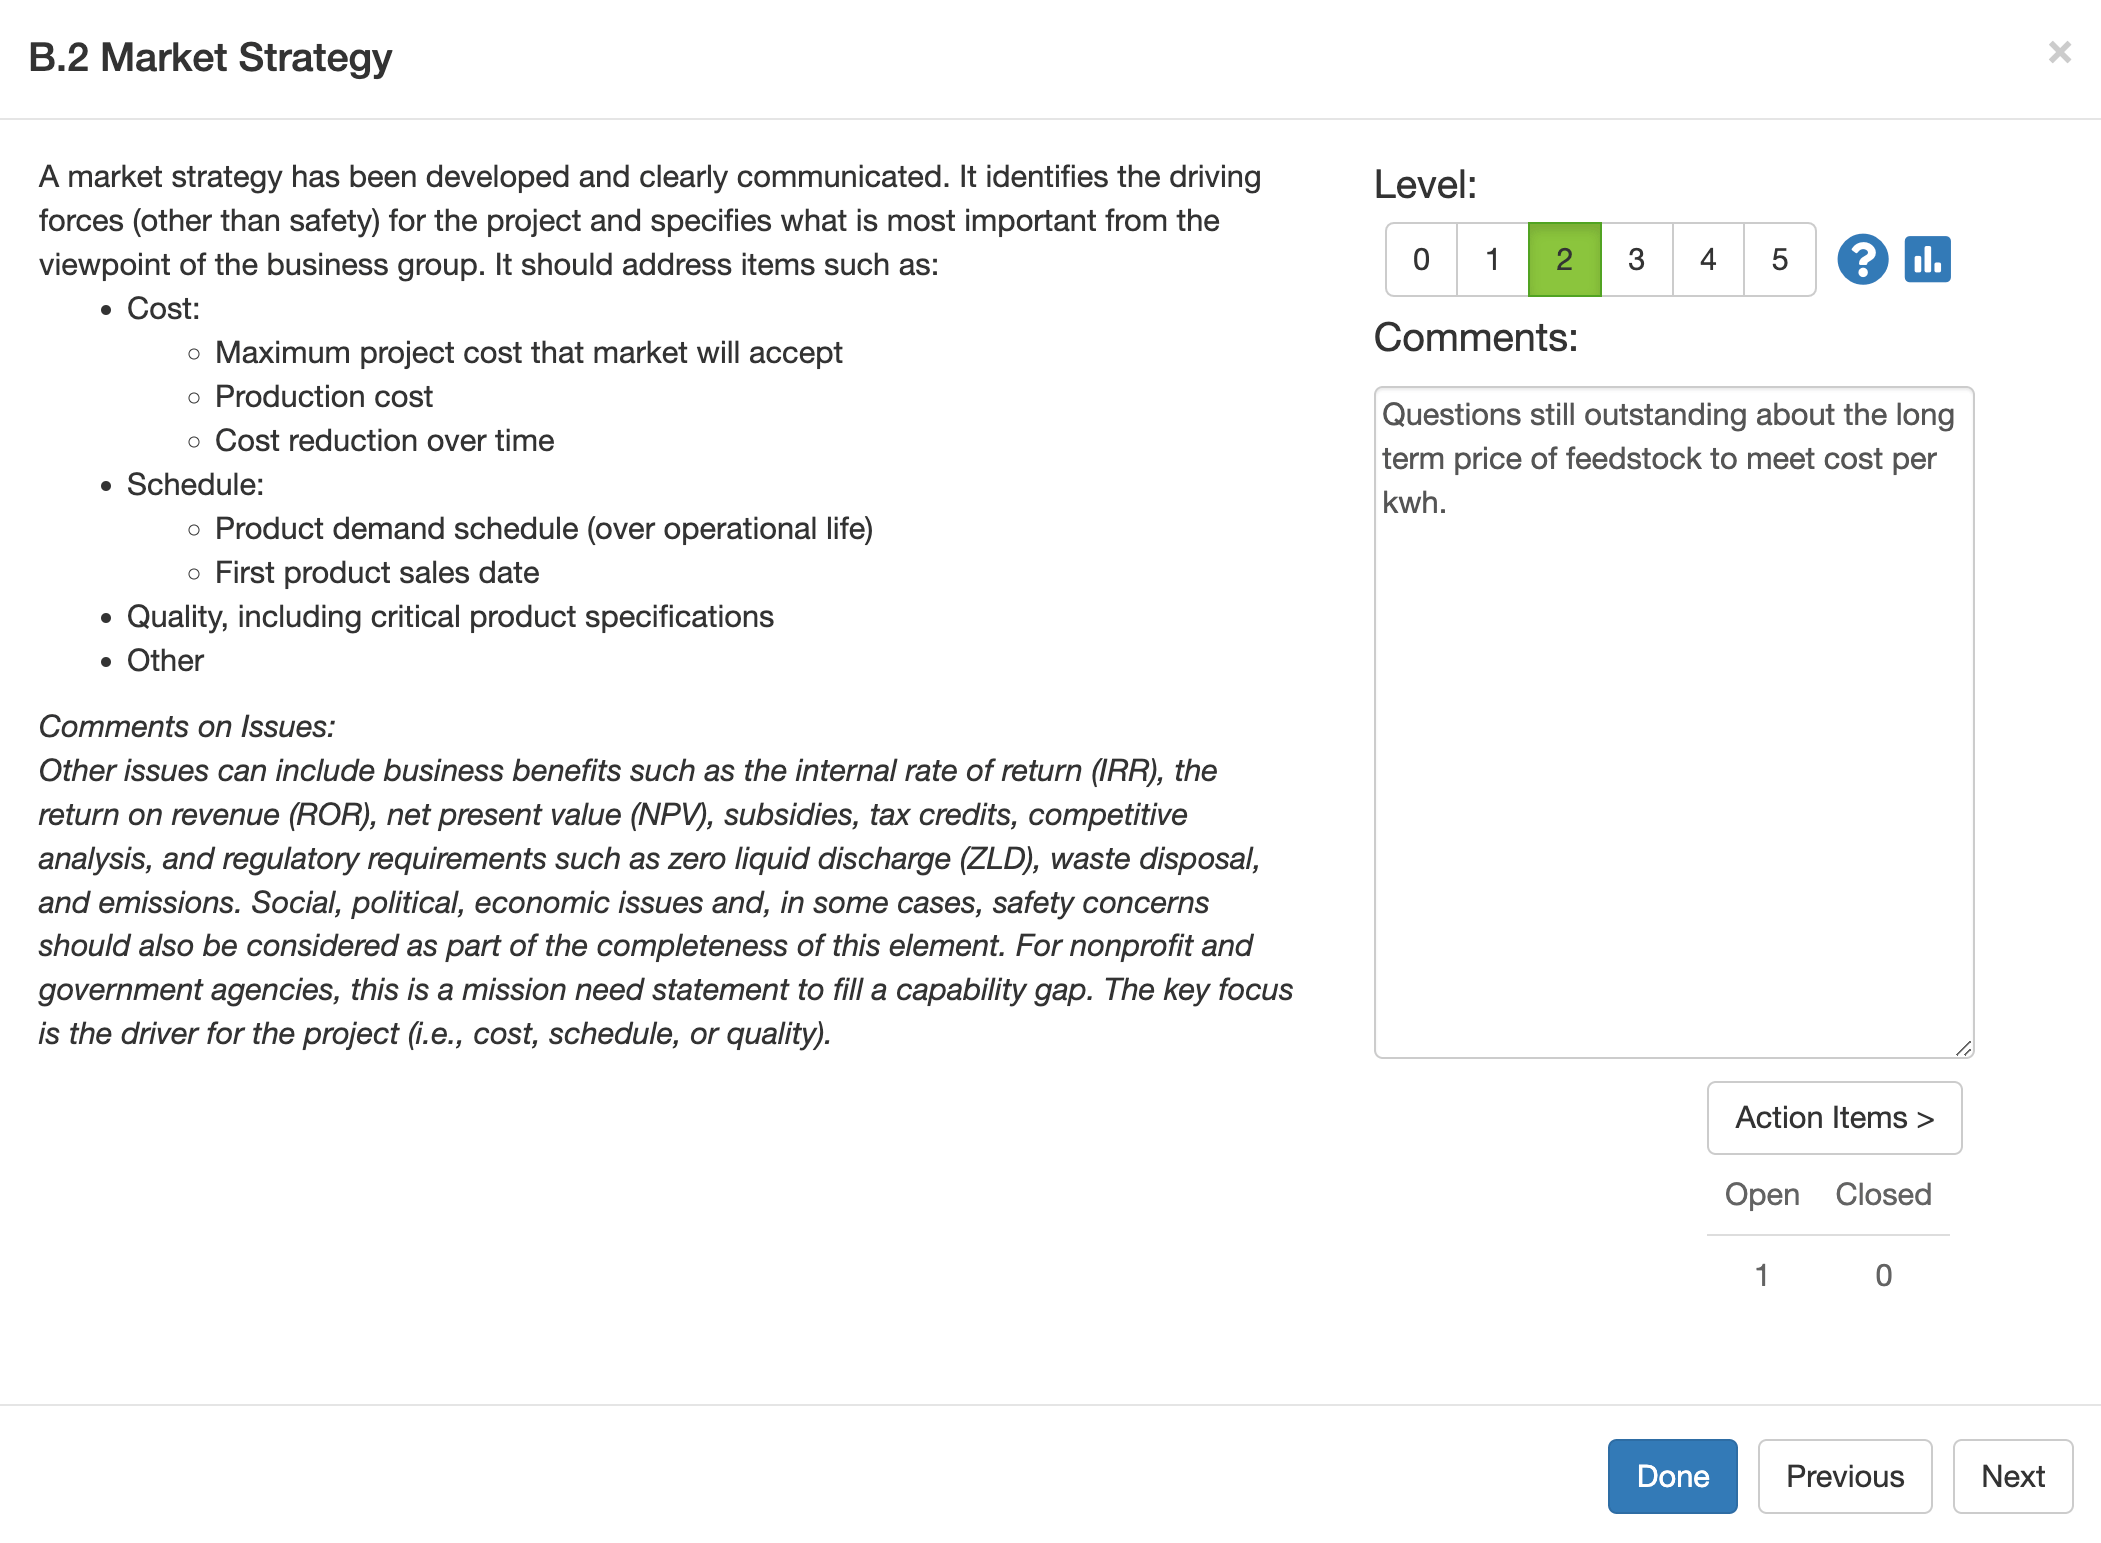
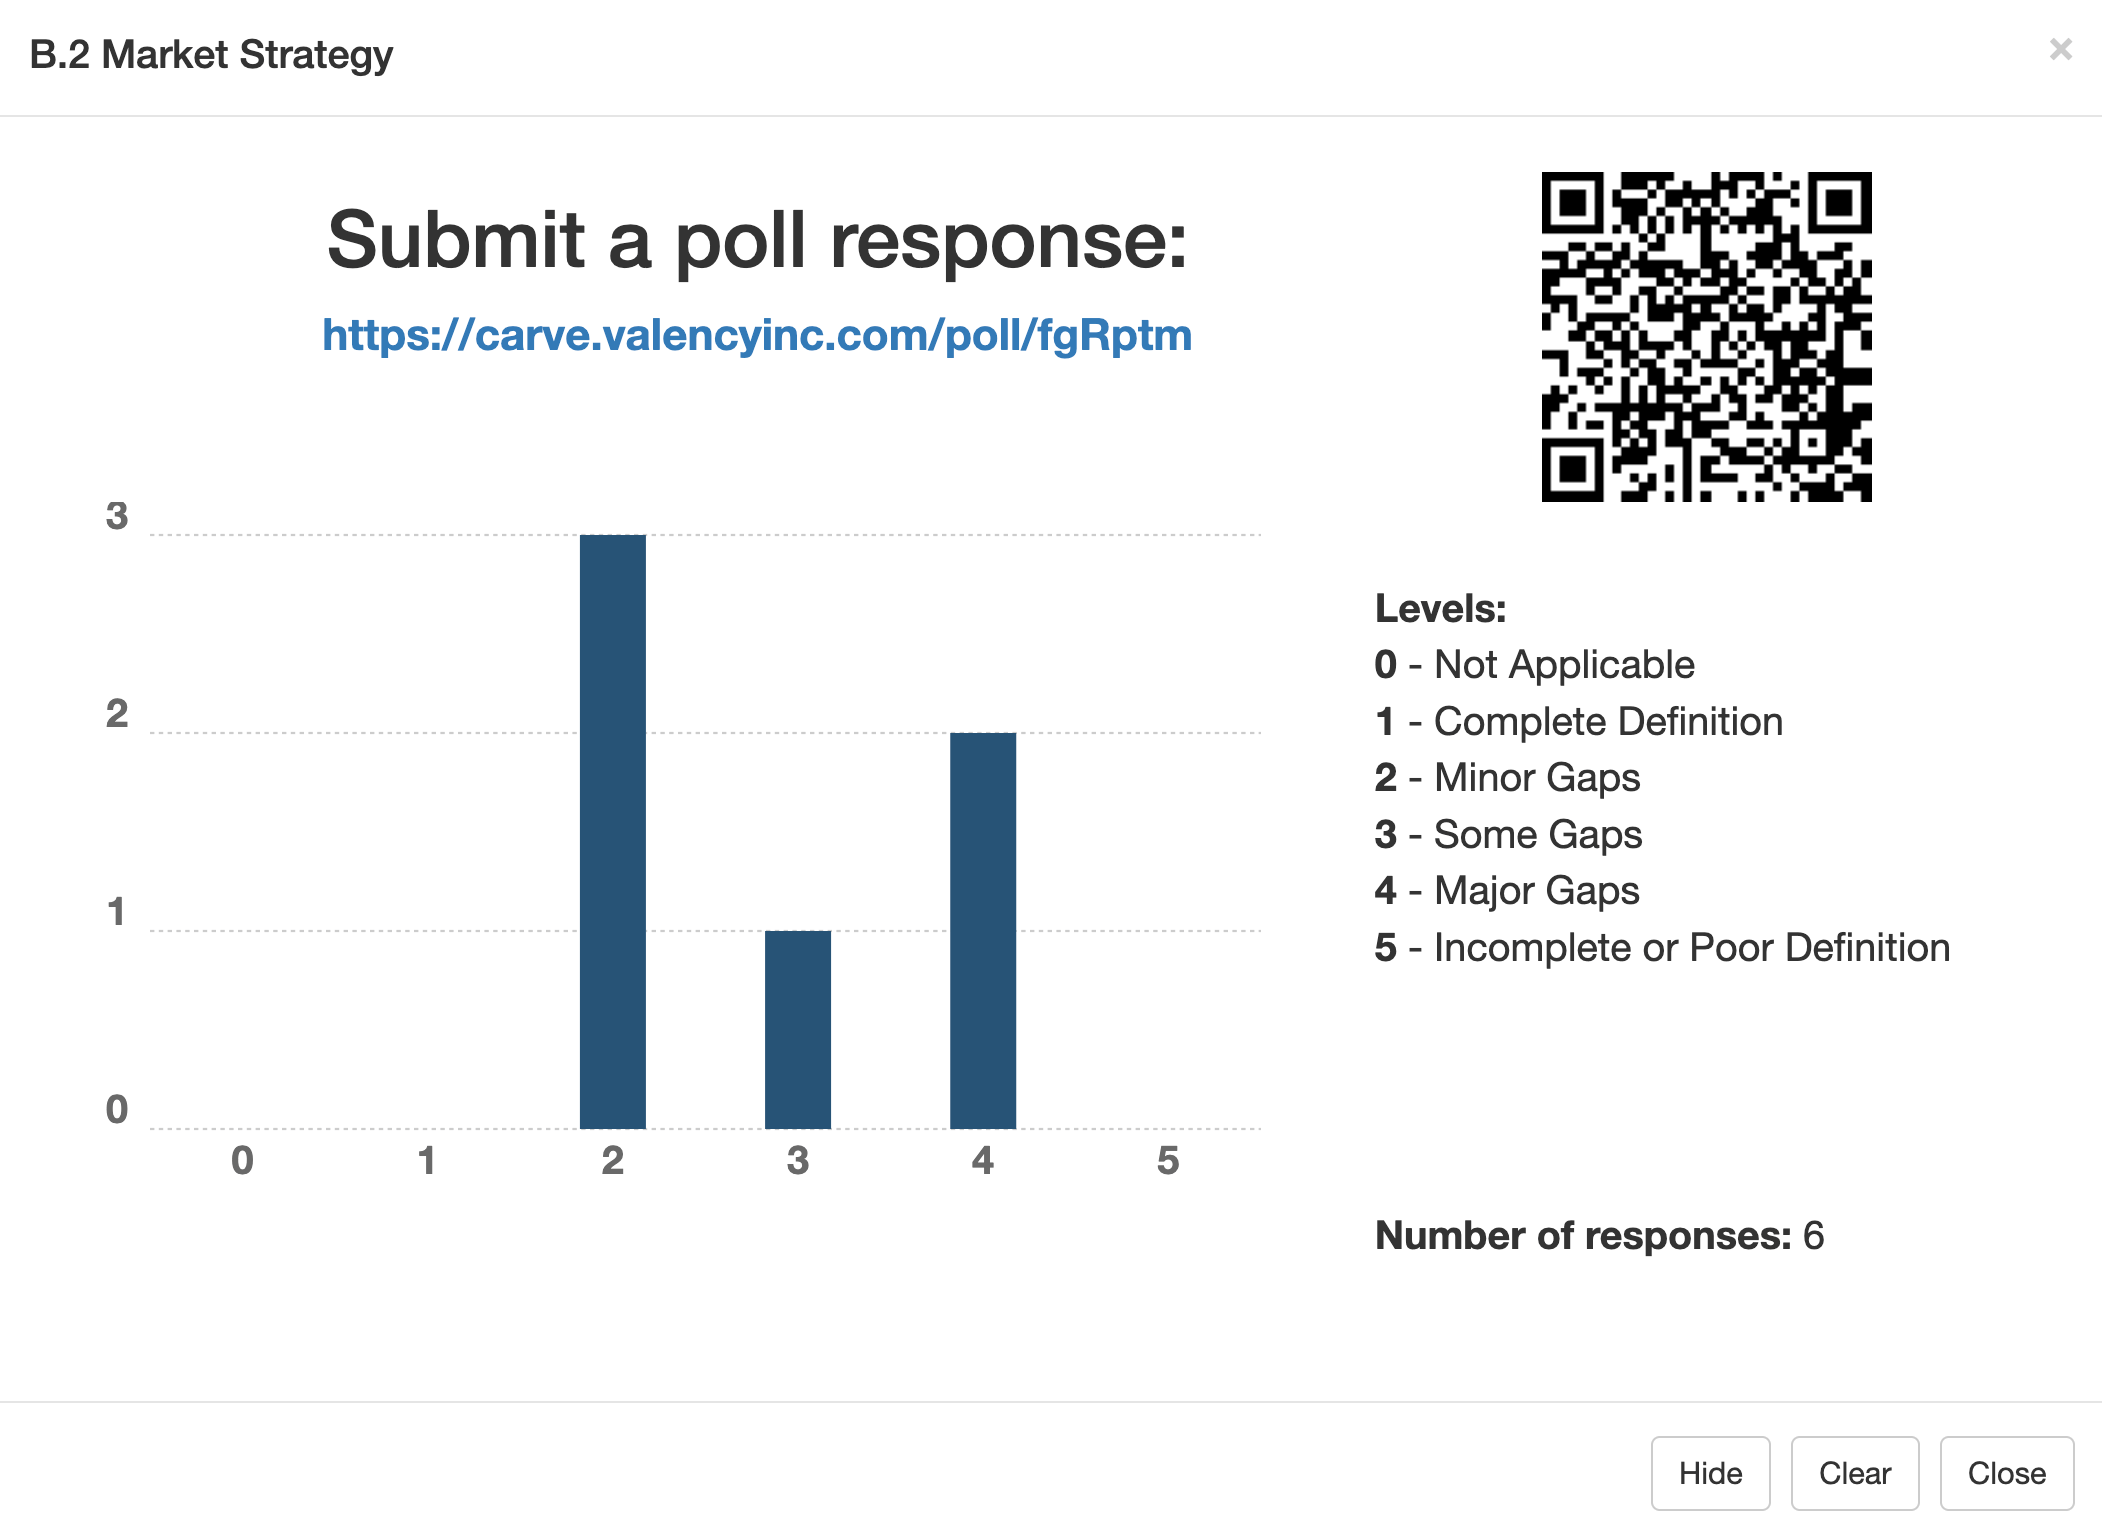
Online assessment summary delivers actionable insights

Share the results of a project’s PDRI session in an interactive manner that highlights identified risks (low definition items), action items, and comparison to relevant industry and portfolio benchmarks.

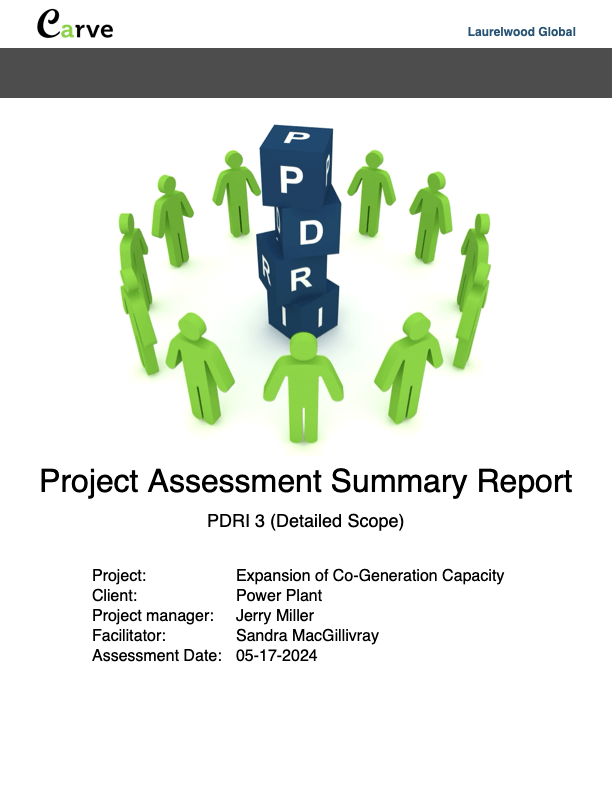
PDF summary report engages senior stakeholders

Create your PDRI Summary report in just one click. Communicate results in a manner that allows your executive team, board of directors, or investors to gain a clearer understanding of outstanding project risks without needing an in-depth understanding of PDRI.

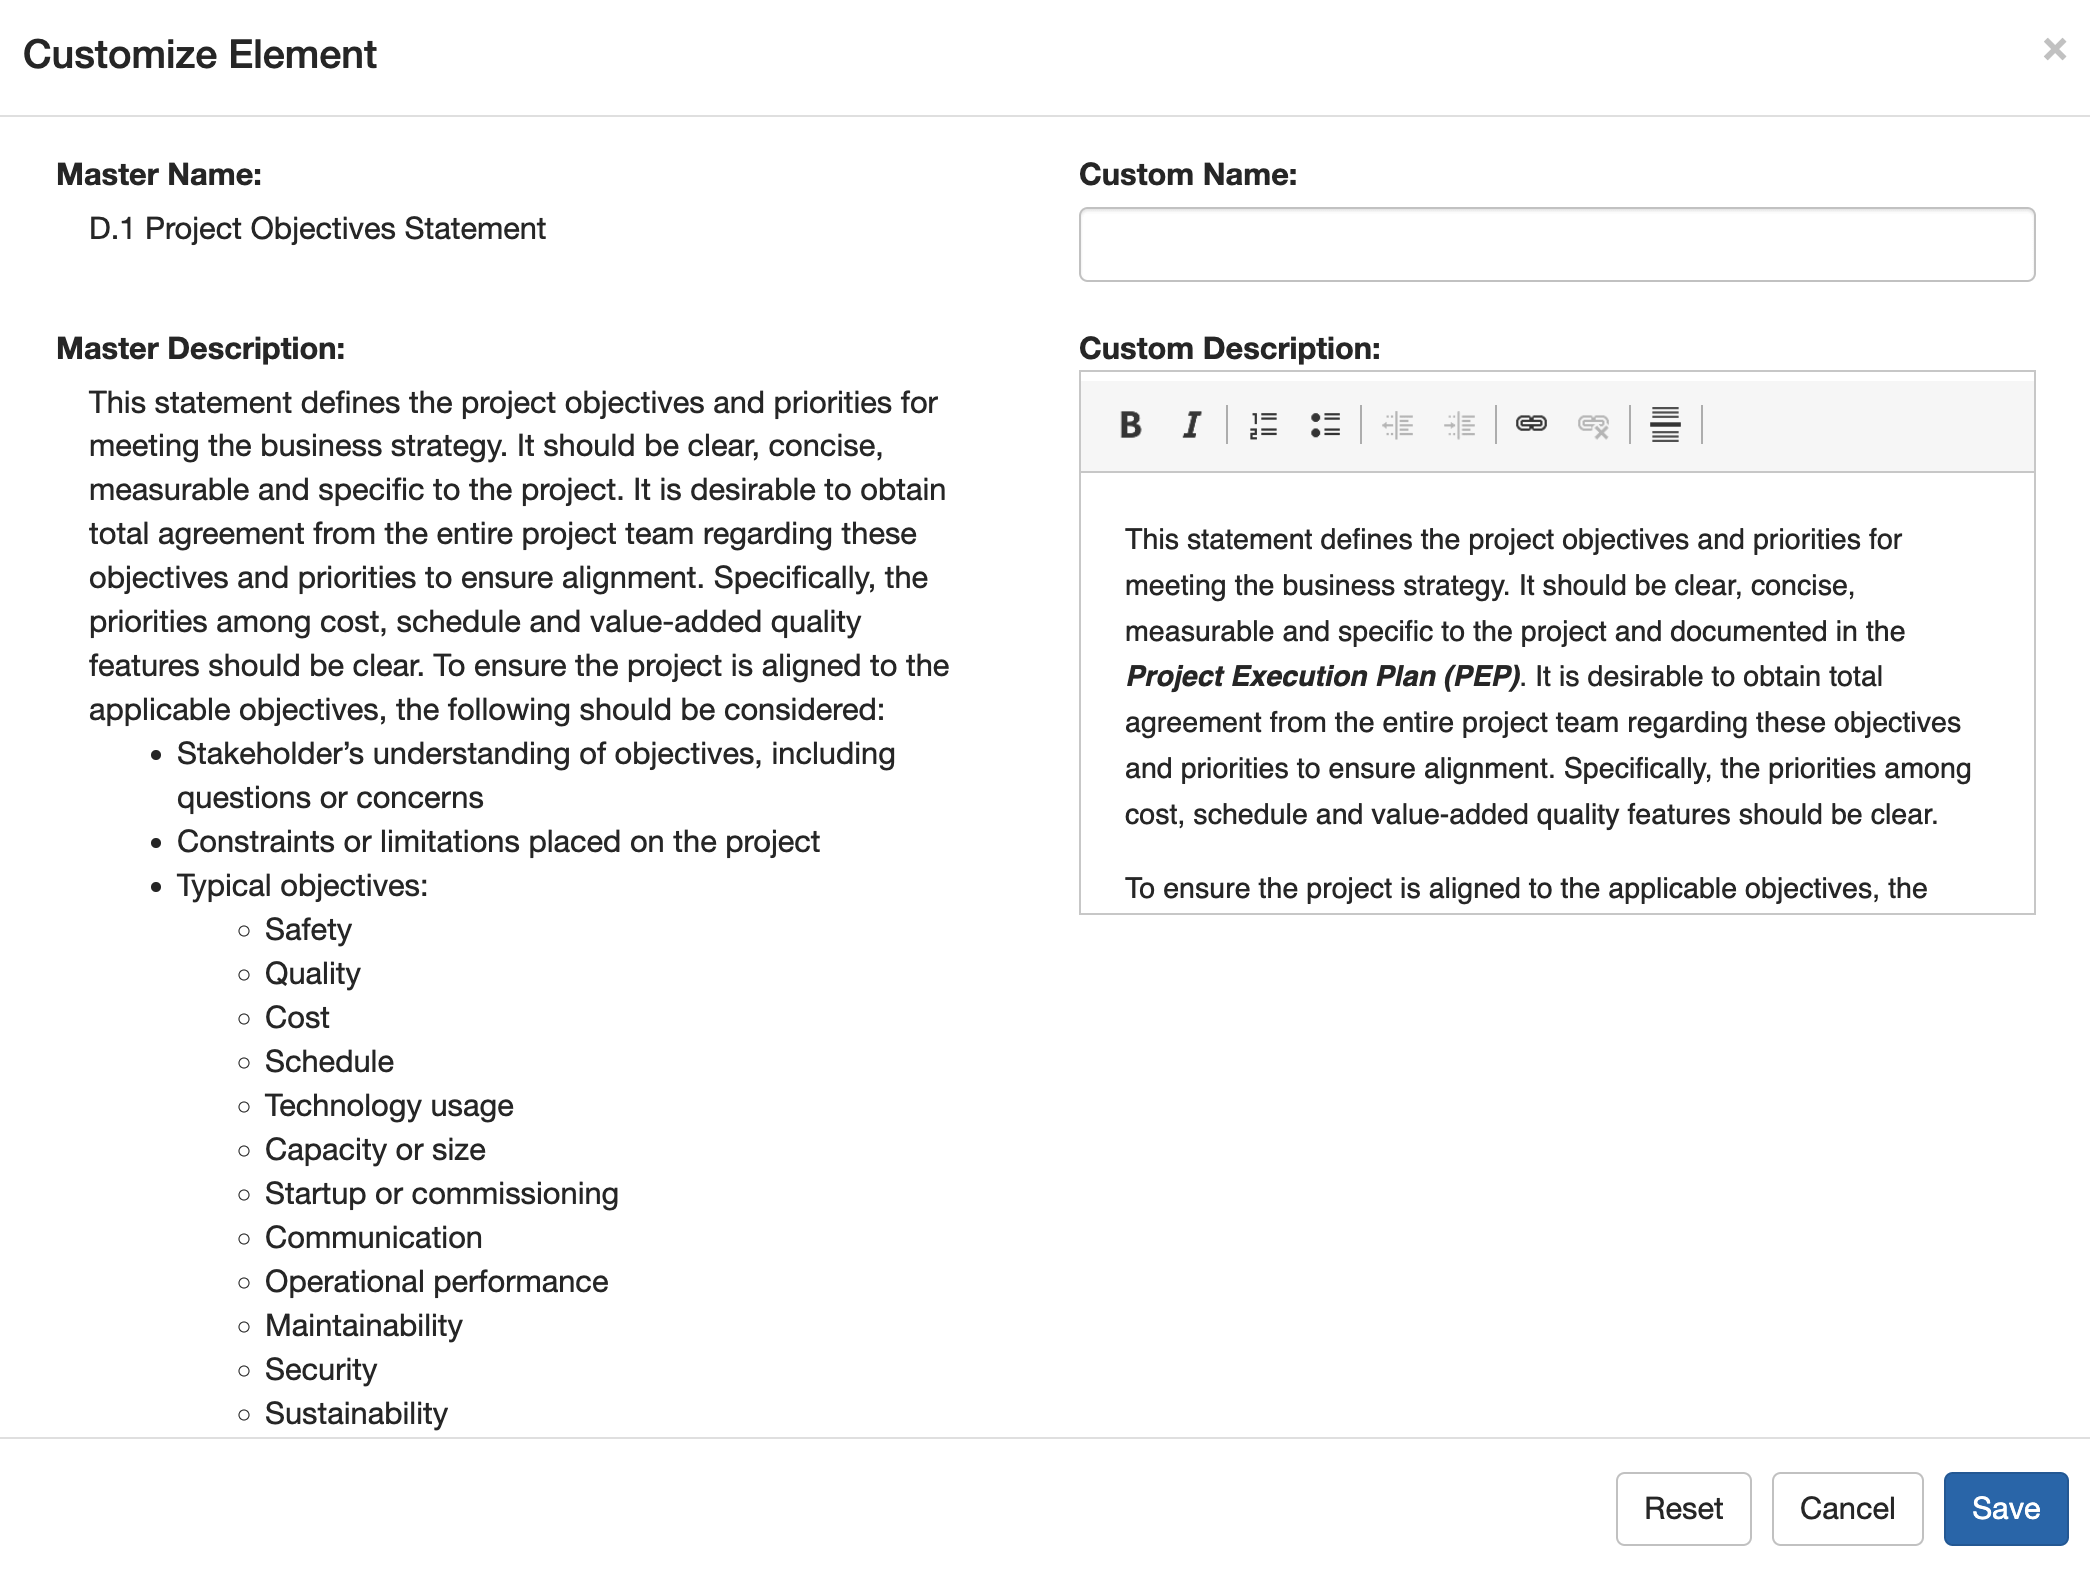
Customize PDRI templates fit-for-purpose to your organization

Customize element names and descriptions and make PDRI ‘fit-for-purpose’ to your organization. Incorporate business unit considerations, corporate policies and procedures, gate deliverables and regulatory requirements.

Carve for Portfolio & Program Managers

If your organization manages capital spending at a program or portfolio level, Carve helps equip your program and portfolio managers with increased insight into the portfolio-level risk of projects in front end planning.
Portfolio summary

Monitor the risk profile of each portfolio

Portfolio managers gain insight into the aggregate risk profile of projects in their portfolio at each stage of the front end planning process.

Focus attention on higher risk projects

Portfolio managers can easily classify projects based on risk, in particular as they move from front end planning into execution. Focus on the exceptions and drill down into higher risk projects with a single click.

Carve for Continuous Improvement

Carve provides those responsible for your center of excellence or continuous improvement with a comprehensive insight into your front end planning practices.

Identify portfolio weaknesses posing the greatest risk to project execution

Analyze the low definition elements that consistently pose the most risk to successful project execution for each portfolio and stage gate.

Easily understand PDRI element expectations

Don’t worry if you don’t use PDRI every day. Carve helps you access the element descriptions with a simple click.

Benchmarking & Analytics for PDRI

Control Charts in Carve

Monitor the variation of your project assurance processes over time.

If your organization is looking to better understand where there may be systemic issues in your Front End Planning process,  the Control Chart in Carve PDRI Analytics is a good starting point.

As your organization captures assessment data over time, the control chart will illustrate each assessment as sequential number plotted on the timeline. Portfolio managers can easily identify projects that are outliers and can quickly drill down to investigate areas of concern.

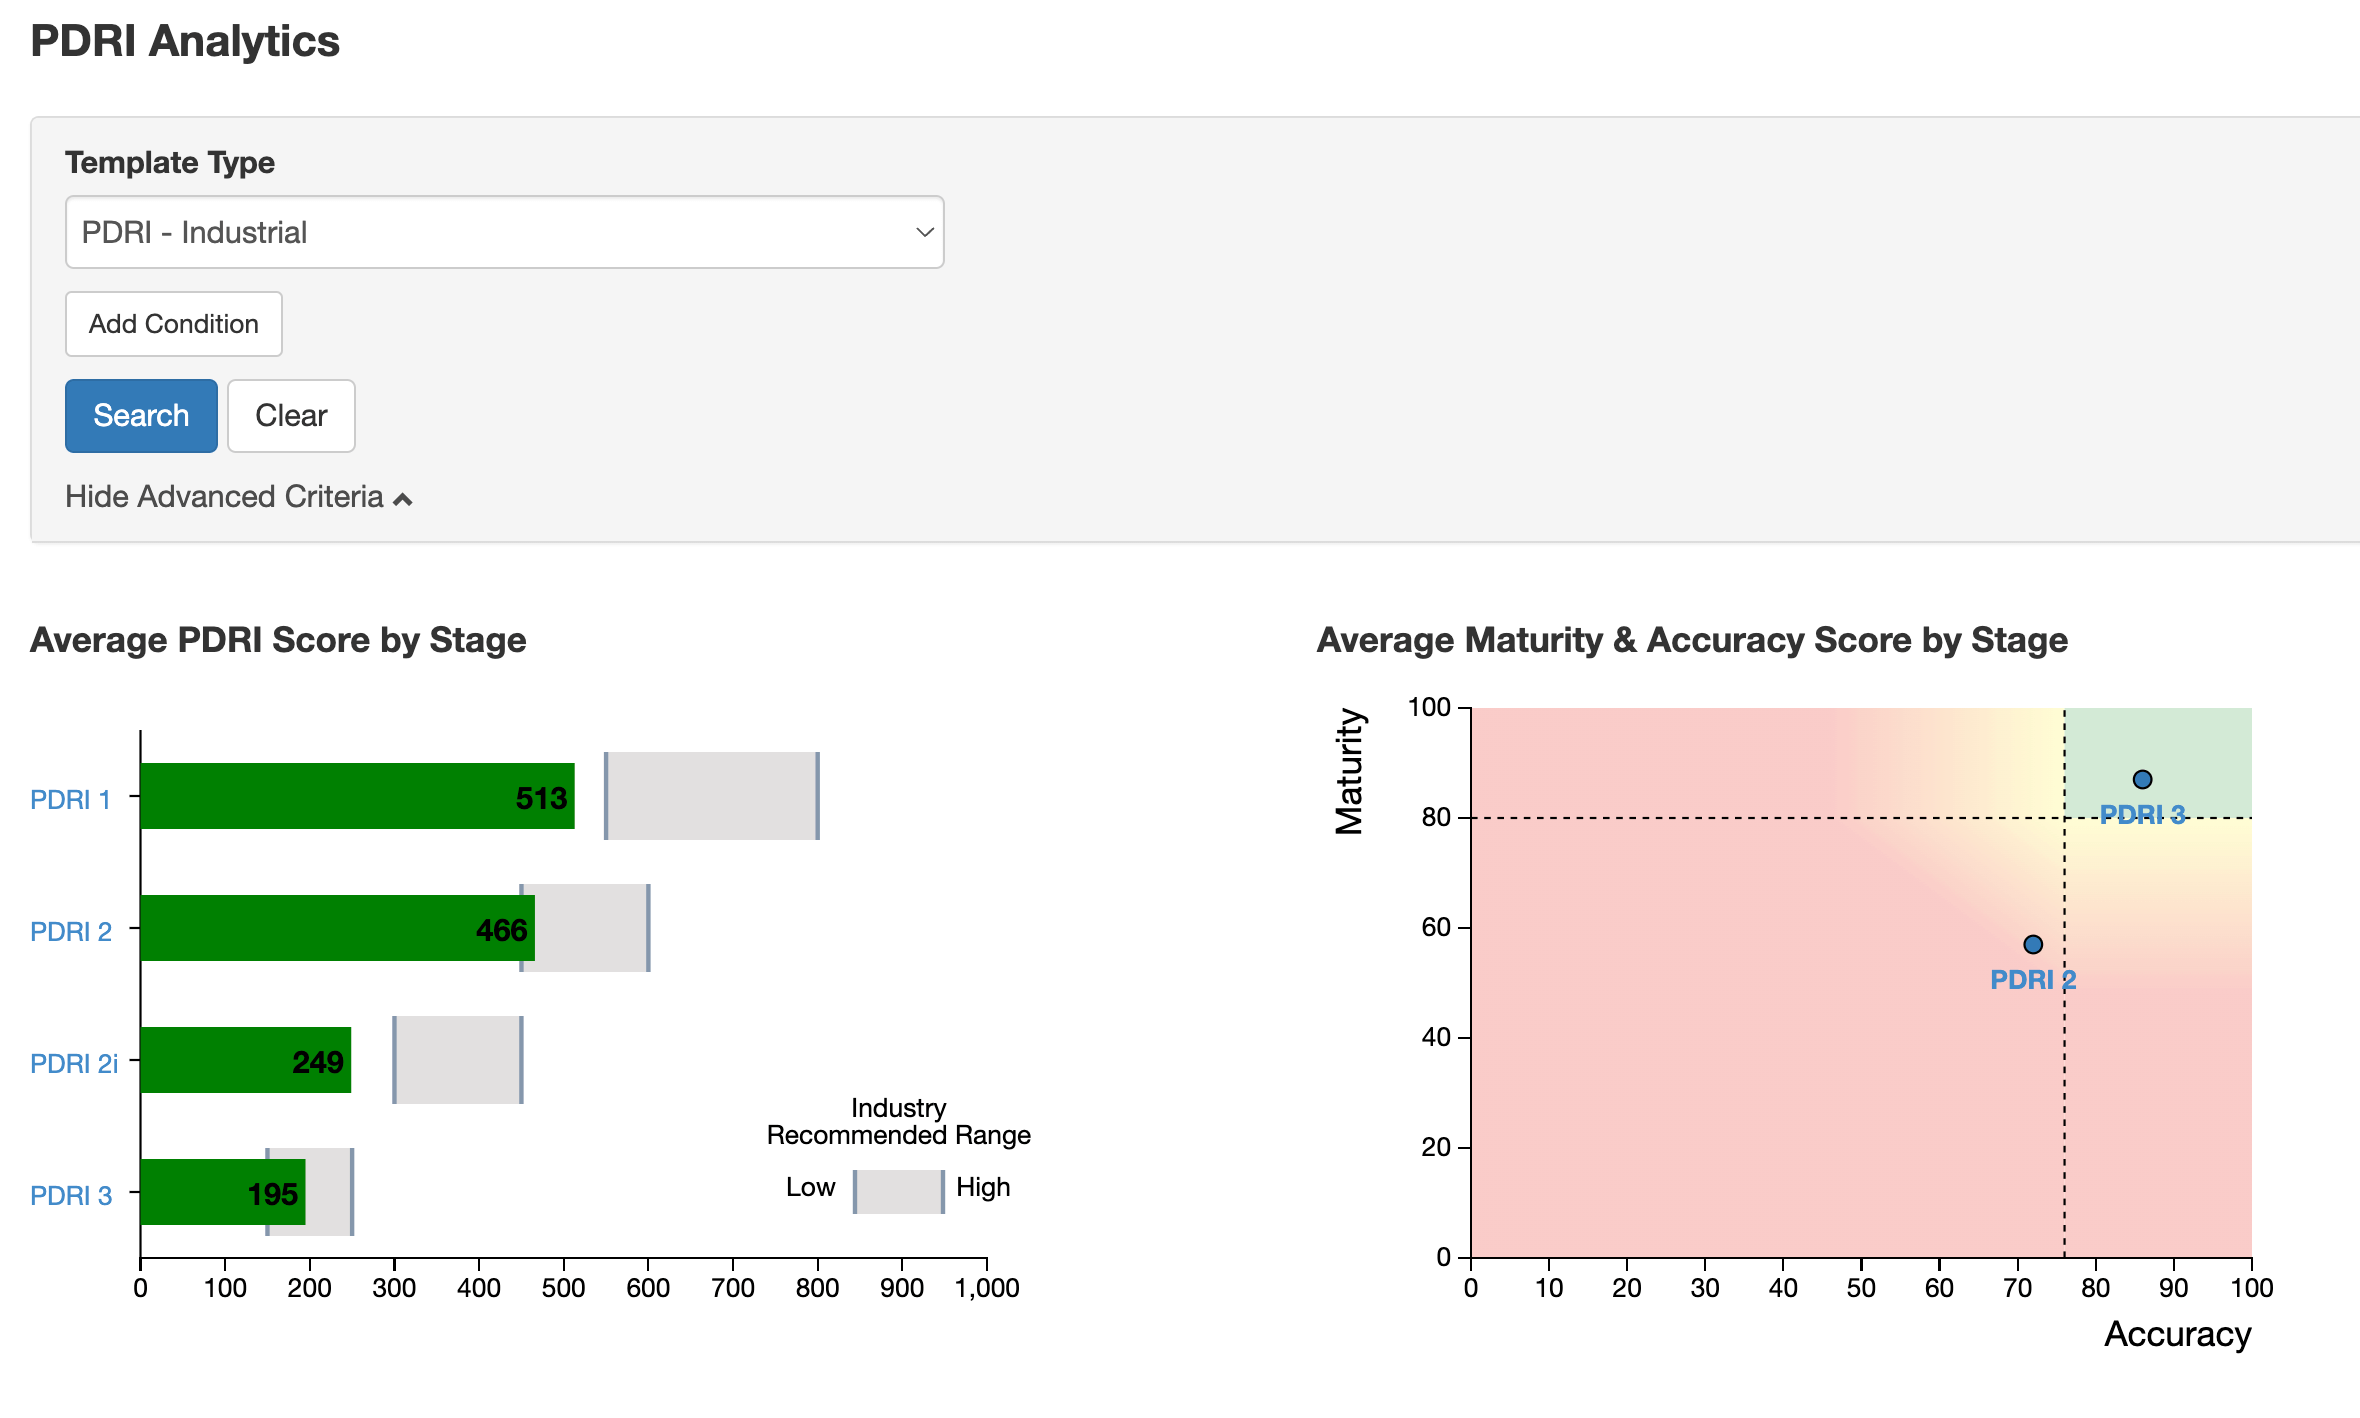
Average PDRI Score by Stage

“What stage of the front end planning process are we seeing challenges?”

PDRIs can be used at multiple points during Front End Planning and normally coincide with a completion of a stage. Organizations that adopt PDRI as part of their project governance normally require a minimum of two PDRI sessions.

  • PDRI 1 is conducted at the end of the Feasibility phase
  • PDRI 2 is conducted at the end of the Concept phase
  • PDRI 2i is conducted part of the way through Detailed Scope
  • PDRI 3 is conducted at the end of Detailed Scope

At a glance, you can see whether your projects fall within the industry recommended score ranges at each stage of your process. Clicking on the project stage allows you to drill down into the specific project scores to investigate further.

Projects by PDRI Score

“How are my projects performing in relation to industry benchmarks and other projects of this type?”

PDRI assessments have a recommended score range based on the stage the assessment was conducted. Higher scores generally indicate a higher level of risk. This can be a leading indicator of project outcomes.

This chart indicates which projects are at risk based on their PDRI score at a given stage and gives an overall view of performance in comparison to similar projects at the same stage. Clicking on the project name allows you to drill down into the assessment details for further analysis.

This view can also be filtered to identify trends based on portfolio, project manager, client, project type, location, etc.

Average PDRI Section Score

“What area of Front End Planning are we experiencing the most challenges?”

PDRI assessments contain three sections:

Basis of Project Decision – the business objectives and drivers
Basis of Design – processes and technical information required
Execution Approach – for executing the project construction and closeout

Each section is broken down into categories and elements. The element is the lowest level of the index.

For larger projects a fourth section can be used called ‘Accuracy’ to evaluate how the work gets done (people, teams, process, resources).

Reviewing the average section score can be a good starting point for identifying areas where there may be systemic issues in your Front End Planning processes.

Trends can be identified by using the Advanced Criteria filters to segment the data by portfolio, project manager, client, project type, location, etc.

Average PDRI Category Score

“What categories are showing the most risk?”

Each section of the PDRI assessment contains multiple categories.

Categories vary depending on the type of assessment (e.g. PDRI for Buildings versus PDRI for Industrial projects).

Some examples of categories include:

– Business Strategy
– Site Information
– Process / Mechanical
– Deliverables
– Project Execution Approach

Each category contains multiple elements. The element is the lowest level of the index.

Reviewing the top 5 or 10 average category scores at a particular stage can provide more detailed insight into where there may be systemic issues in your Front End Planning processes.

Using Advanced Criteria filters to segment the data by portfolio, project manager, client, project type, location, etc. can help narrow this down even further.

Average PDRI Elements Score and Low Definition Elements Drill Down

“Are there any commonalities that will help identify a process / resource gap?”

Elements are the lowest level of the PDRI assessment of which the project team scores on a likert scale from 1 (complete definition) to 5 (incomplete or poor definition).

Reviewing the top 5 or 10 low definition elements can be helpful in pinpointing specific tasks where there may be opportunities for improvement in your Front End Planning processes.

Clicking on the element in the bar graph will take you to the Low Definition Elements Drill Down allowing you to review comments and action items which can provide valuable insight into potential process or resource gaps.

Average Maturity & Accuracy Score by Stage

“How are we performing in terms of FEED (Front End Engineering Design)?”

The latest PDRI Industrial template includes additional metrics for Maturity and Accuracy factors.

Maturity score: There are 46 factors that indicate the level of maturity during FEED (Front End Engineering Design). A higher maturity score indicates better scope definition. The target maturity score at the end of Detailed Scope (PDRI 3) is 80% or higher.

Accuracy Score: The 27 factors that contribute to the Accuracy score which measure how the work gets done – the people, teams, processes and resources that contribute to a mature FEED. The target score at the end of Detailed Scope (PDRI 3) is 76%.

This graph quickly identifies how your projects are performing in terms of FEED. By clicking on the hyperlinked stage, you can view each project and drill down further into project details to investigate opportunities for improvement.

Projects by Maturity & Accuracy Score

“Are we providing sufficient time and resources to define engineering documents, outputs and deliverables?”

Industrial projects have an additional set of scoring indicators that illustrate the level of maturity in Front End Engineering Design (FEED).

This graph allows you to compare project performance based on the Maturity and Accuracy scores.

Hovering over the number will display the project name and corresponding score. Alternatively, the projects are listed below the chart as a table for quick reference.

Clicking on the project name in the table will take you to the assessment details to support further analysis.

Average Accuracy Score by Stage

“Have we provided adequate leadership, team members, processes, resources to support the FEP process?”

Carve for PDRI offers organizations the opportunity to measure Accuracy Factors in most PDRI templates including PDRI for Buildings, PDRI for Infrastructure and PDRI for Manufacturing and Life Sciences (MLS).

Accuracy Score: The 27 factors that contribute to the Accuracy score measure how the work gets done – the people, teams, processes and resources that contribute to a mature scope. The target score at the end of Detailed Scope (PDRI 3) is 76%.

This graph quickly identifies how your project leadership, execution team, processes and resources are performing on average at the stage your PDRI assessment was conducted.

Carve Editions

Features Facilitator
Edition
Professional
Edition
Enterprise
Edition
Users Up to 10 Unlimited Unlimited
Projects Tiered Tiered Unlimited
Project dashboard
PDRI Templates
Prepare PDRI summary report
One-step PDF summary report
PDRI assessment dashboard
Export an assessment
User Management
Single sign-on (SSO) support
Email sharing of assessments
PDRI template configuration
Portfolio management
Analytics dashboard
Submit API read requests
Deployment Cloud Cloud Cloud
Support Web/Email Phone + web/email Phone + web/email
Annual Subscription Pricing
Per Year (US$)
Contact Valency Contact Valency Contact Valency


Contact Us

We build certainty into your Capital Project Life Cycle.